
Network monitoring refers to a computer network's overall efforts to detect impaired or failing network elements. These elements include servers, routers and switches and other devices that are either "down" (offline) or in imminent danger of going down. When a network failure or outage happens, the network monitoring system alerts the NA (Network Administrator).
- is a subset of network management
- is typically managed through the efficient use of a collection of software applications
- services are used broadly to detect whether specific IT infrastructure components are working and connected to networks worldwide and
- servers execute network monitoring services that offer a bigger picture of network and internet health (part of IT infrastructure management).
The monitoring system tracks and analyzes network parameters while monitoring the network health and reliability and (hopefully) detecting trends.
Parameters typically include the rate of data transmission or throughput, uptime and downtime, error rates, and use response time in both percentages and automated inputs/requests. After preset parameter thresholds are reached, alarms are triggered, and fault management processes are kicked off.
One of the most fundamental network monitoring tools is Ping. Much more sophisticated software applications can monitor entire geographically dispersed networks from large enterprises to whole businesses. Tools used as network traffic monitors include streaming video to VoIP (Voice over Internet Protocol) monitoring and the monitoring of a POP 3 mail server.
Another way to look at Network Monitoring: It's the exact opposite of an IDS (Intrusion detection system). An IDS monitors networks for threats from outside a specific network.
More on Network Monitoring
The next time you're in a bind while playing a trivia game with your friends, you can toss around the following terms (and see if anyone knows what you mean).
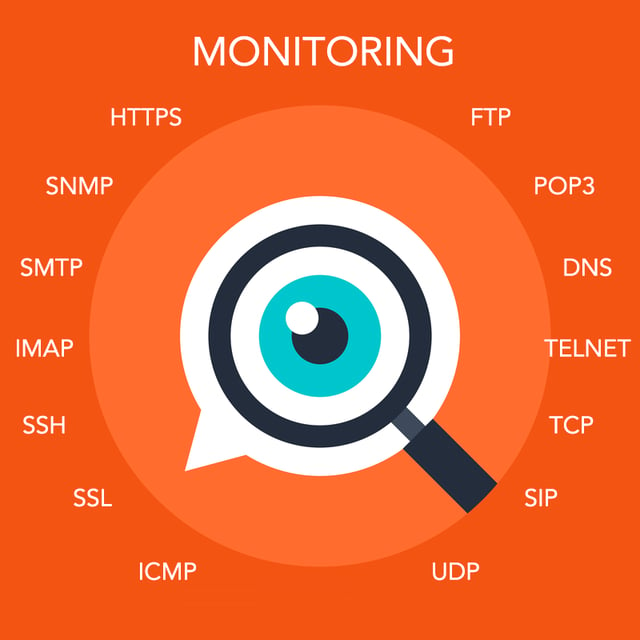
- HTTP Requestsare test pings sent by monitoring software to fetch a page to judge the status of a web server. The same requests for email servers are called SMTP (Simple Mail Transfer Protocol) and are retrieved by POP3 or IMAP.
- Nagios (now Nagios Core) is a broadly accessible open source (free) application that monitors systems, networks, and infrastructure.
- Network Performance Monitoringsupports administrators in measuring the performance levels and the load of each device within the network.
- Network Tomography measures the health of various network links by (agent sent) end-to-end probes located at strategic points in the network.
- Network Traffic Management refers to the monitoring of network uplink performance
- Protocols: Allow different systems to talk to each other via a shared set of rules. Monitoring services can check the following protocols: HTTP pages, HTTPS, SNMP, FTP, SMTP, POP3, IMAP, DNS, SSH, TELNET, SSL, TCP, ICMP, SIP, UDP, Media Streaming, and other ports at various intervals (anywhere between each hour and each minute).
- Route Analytics is essential to understanding how network effectiveness is measured. It deals with all the tools, systems and techniques that monitor the routing behaviors of networks. Inefficient or incorrect routing issues cause performance slowdown and downtime.
Integrating Network Monitoring Data into an AIOps Platform
Network Monitoring needs an efficient monitoring platform. Monitoring platforms listen, gather, and co-relate events from critical applications and their underlying IT environment. A well-defined platform empowers system admins to dynamically migrate into another technology or architecture (monolithic applications, micro-services, and micro applications) that scale on-demand. This monitoring platform also helps with monitoring servers, monitoring systems, and monitoring tools.
Network Monitoring: Typical Hazards Today
How to Avoid Outages?
Businesses are depending on IT applications more than ever before. Downtime and performance problems in IT applications within the IT infrastructure hit the bottom line revenue of a company. IT Operations teams have to rethink how they manage outages because the old plans don't work anymore.
Evanios predicts service issues by identifying hidden event patterns that typically lead to outages. Choose automatic remediation, and/or create alert notifications based on your preferences.
Watch the Flood!
Monitoring systems and other point management tools produce a flood of events, most of which are not relevant. You can't tell the signal from the noise.
These events need to be ordered, then turned into incidents when there’s a real issue. In fact, the event volumes are so high that many of the critical events get lost in the chaos. Many times, support teams only find out about service issues when users start to scream.
The 2018 Digital Enterprise Journal study 17 Areas Shaping IT Ops in 2018 sums it up best:
“With increasing IT complexity, more data can have a negative impact on the performance – unless this data is delivered in a context that is actionable and relevant.”
Evanios eliminates event noise. It normalizes, filters, deduplicates, correlates data from multiple sources, applying advanced noise reduction methodologies to reduce event floods to a few actionable signal events.
Root Cause is not Root Canal, but you Might Confuse the Two
Typical methods used to locate root cause? They no longer work, because they were designed for more static IT infrastructures, not the complex systems in place today.
Automate the detective work. Evanios finds and scores a small set of probable causes based on machine learning, historical probability, CMDB relationships, change management actions, automation actions, and temporal alignment.
Let Evanios support your network monitoring strategy. Check out our pre-packaged integrations to tools like Paessler PRTG, SevOne, SolarWinds Orion, and ThousandEyes. And contact us for a demo if you would like to see more.”














.png)
.png)


.png)


.png)


